
We've been busy at WattsBoard with quite a few things lately. I'll just cut to it:
Estimate Future Performance Levels
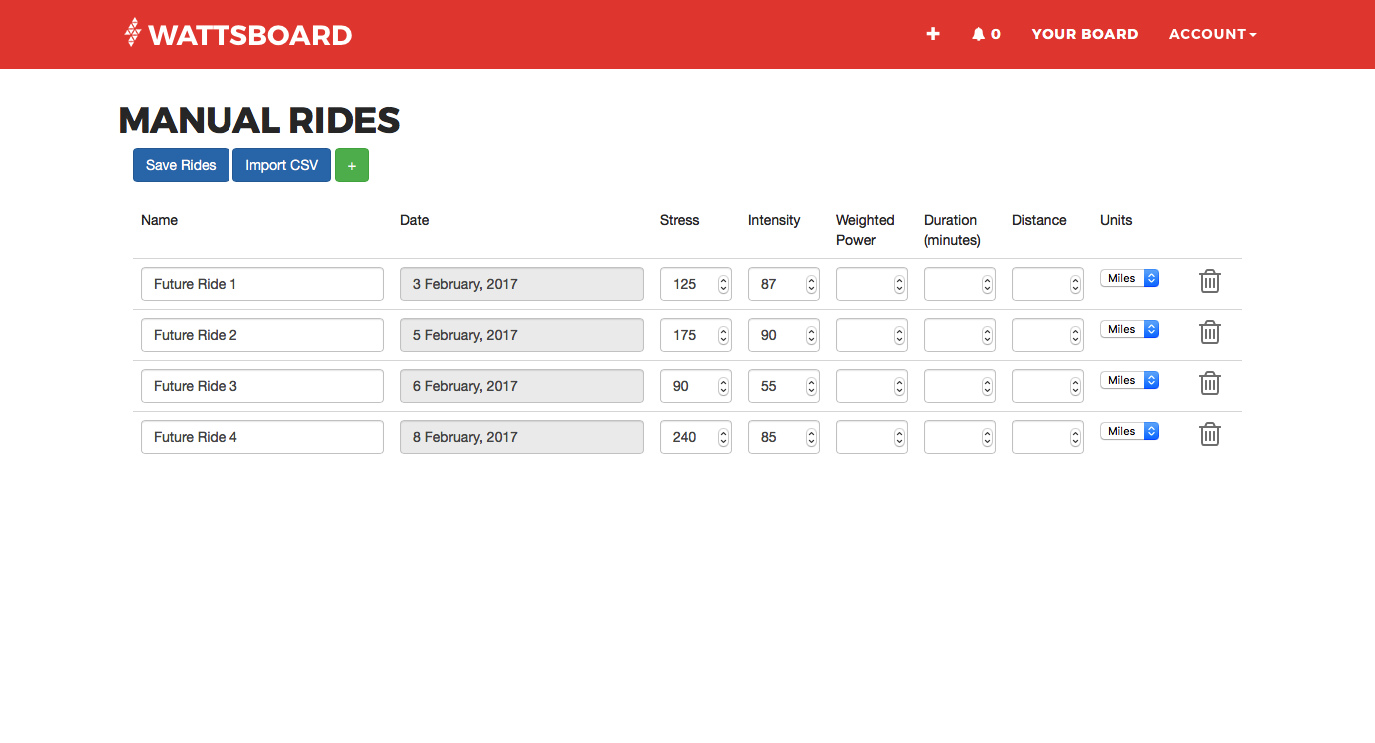
I'll start with two of my favorite new features: WattsBoard now allows for manually input rides and future 'predicted' rides. Did your computer die before the ride even started? Input the ride manually - just estimate the stress and intensity and it will be included with your performance data.
You also have the ability to add a ride in the future. It's pretty easy to do, and if you have a training plan in an Excel or CSV document, you can even load that in. We'll take care of the rest. Just start by manually entering your rides with a date in the future (these images were taken on Feb 1, 2017):
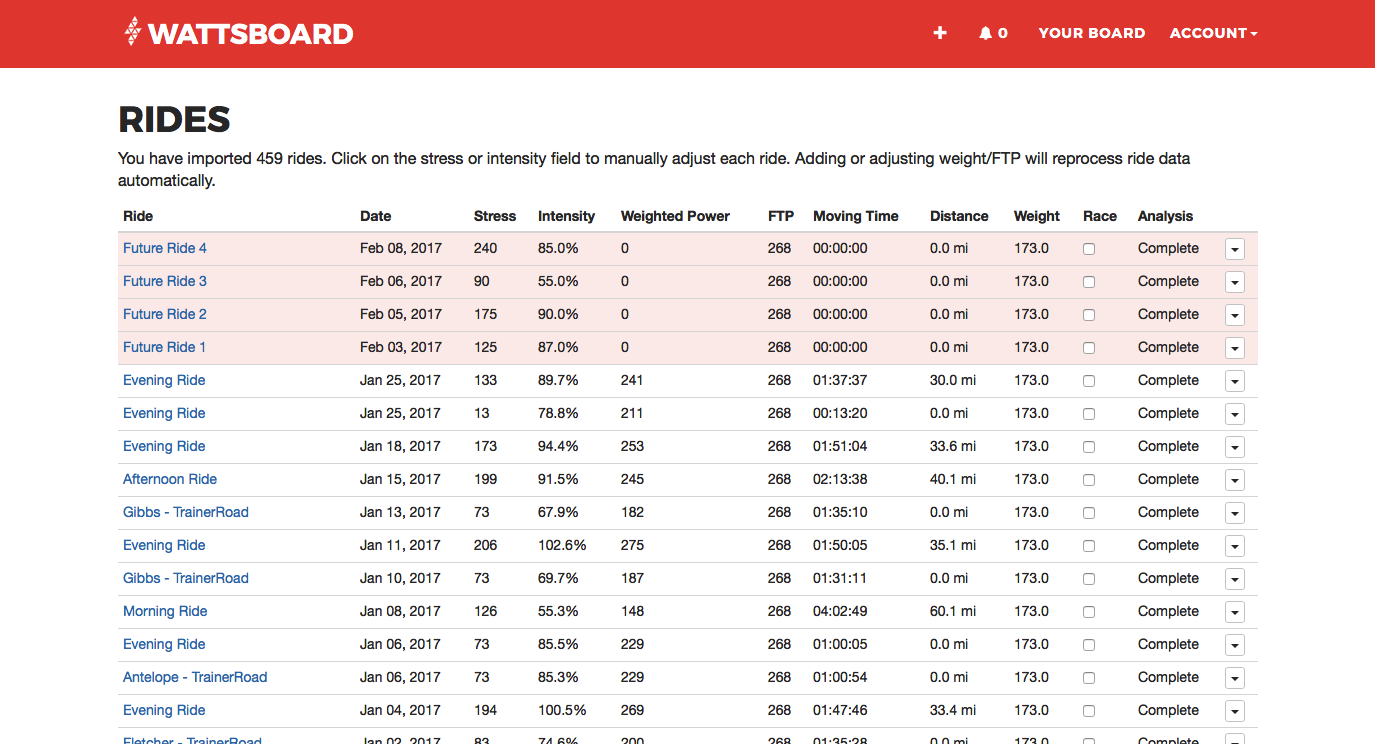
Any time you add a ride with a future date, we'll mark the ride as a 'predicted' ride and will keep it in red on your rides page:
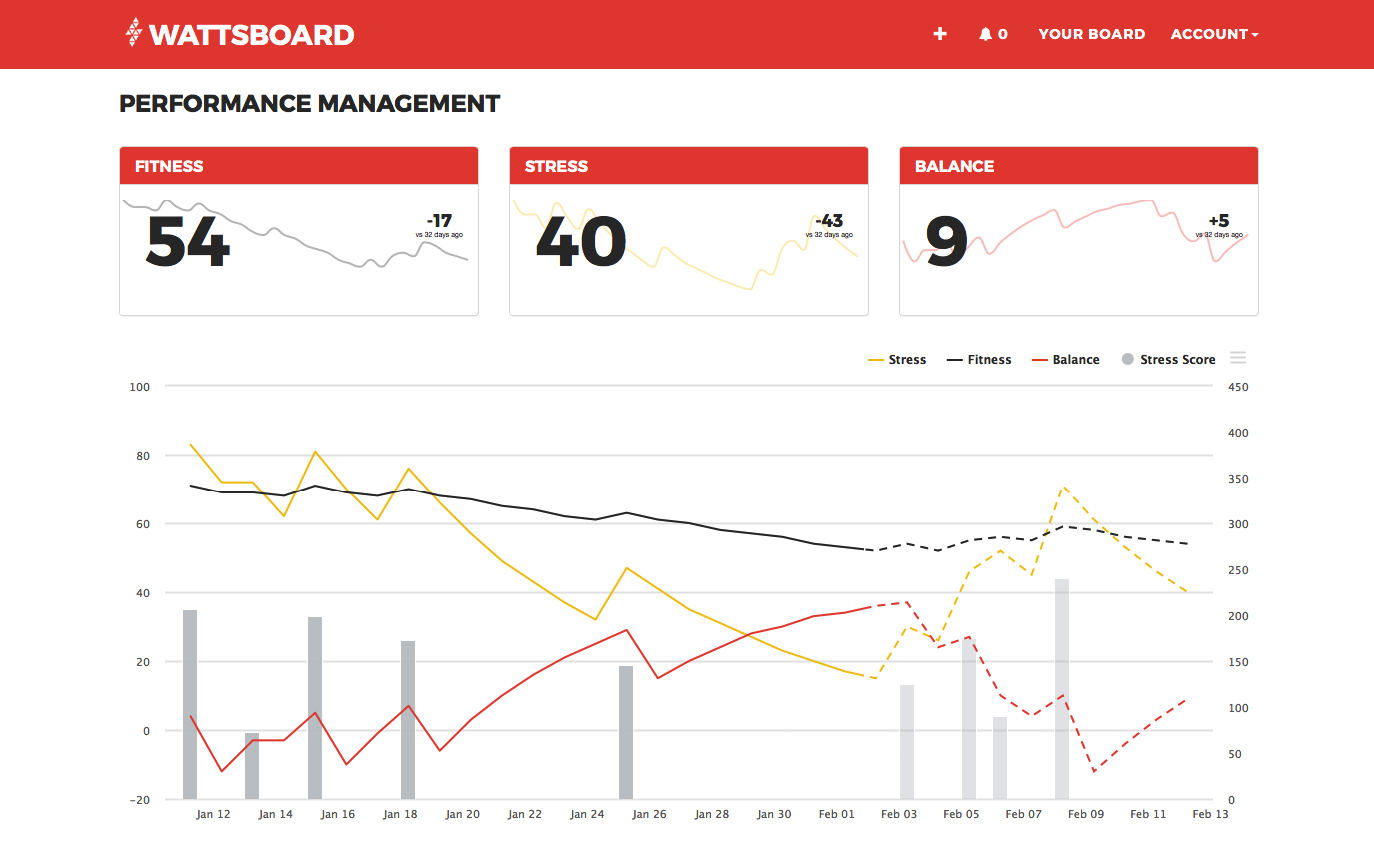
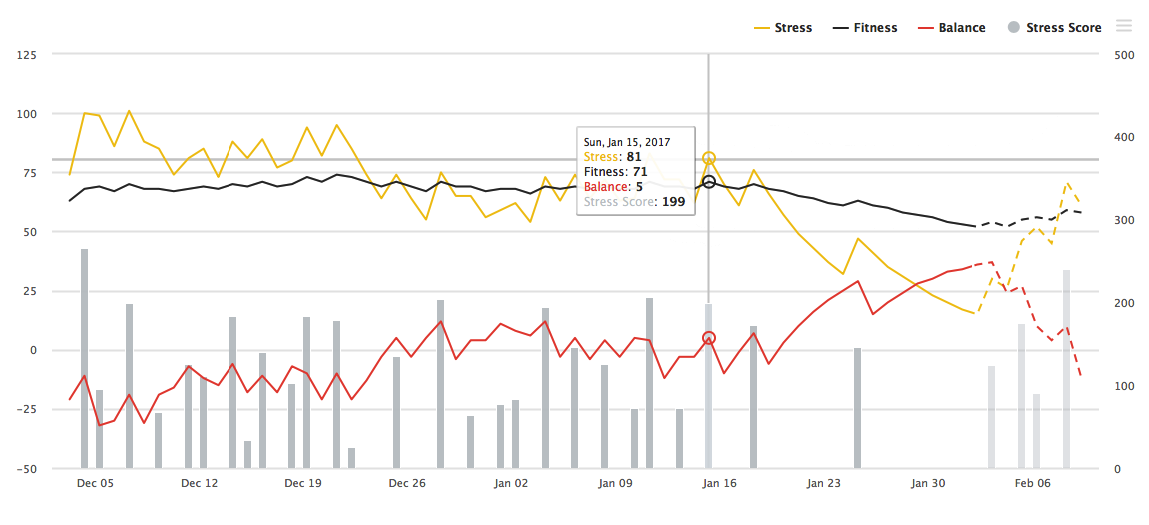
You'll also find the data included in your performance chart. Prediction data is indicated by a dashed line. So if you want to plan out your upcoming season, add in a list of rides and predict what your performance will be for specific dates in the future.
While it seems like your data might get messy, it won't. Once the date of a future ride has passed, we won't include it in your performance chart anymore. We'll keep it in your rides list for reference, but no longer will the stress or intensity levels be included in your performance chart.
New Charts
We've also updated our charts. We switched over to a library called Highcharts. Using a library like Highcharts allows us to stop worrying about basic chart features and just focus on building value by creating useful tools. Here are a few of the first features that we were able to integrate with the new charting library.
View the ride when you set a max power record
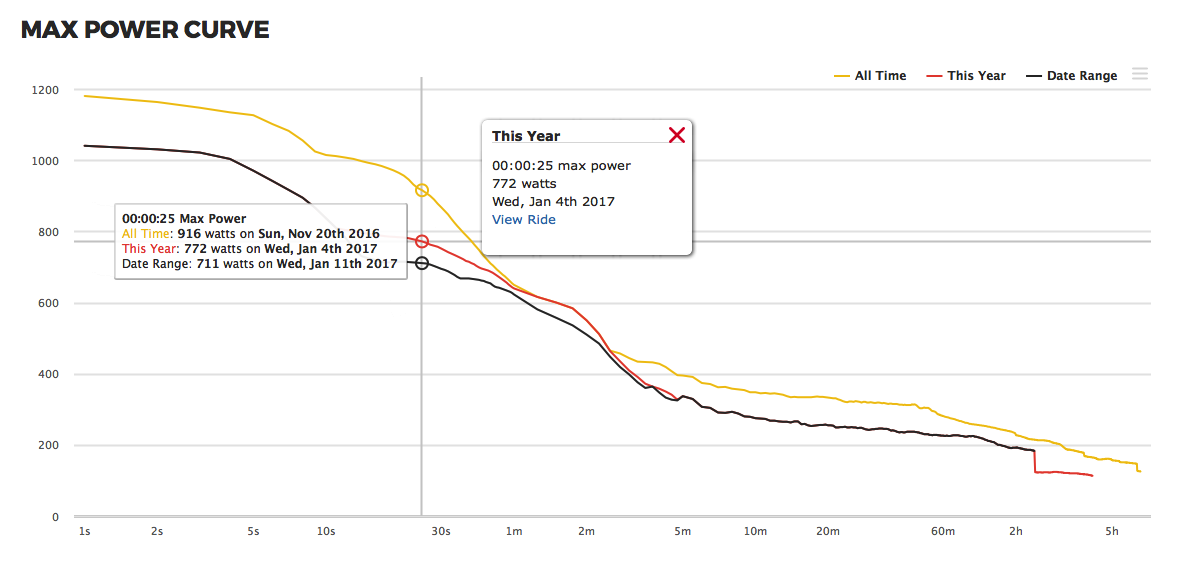
Have you ever wondered what ride you set a power record on? The Power Curve chart now includes data on when a record was set. When you hover over each interval, the date is shown. Clicking on the specific datapoint will pop open a small detail window that links to that ride.
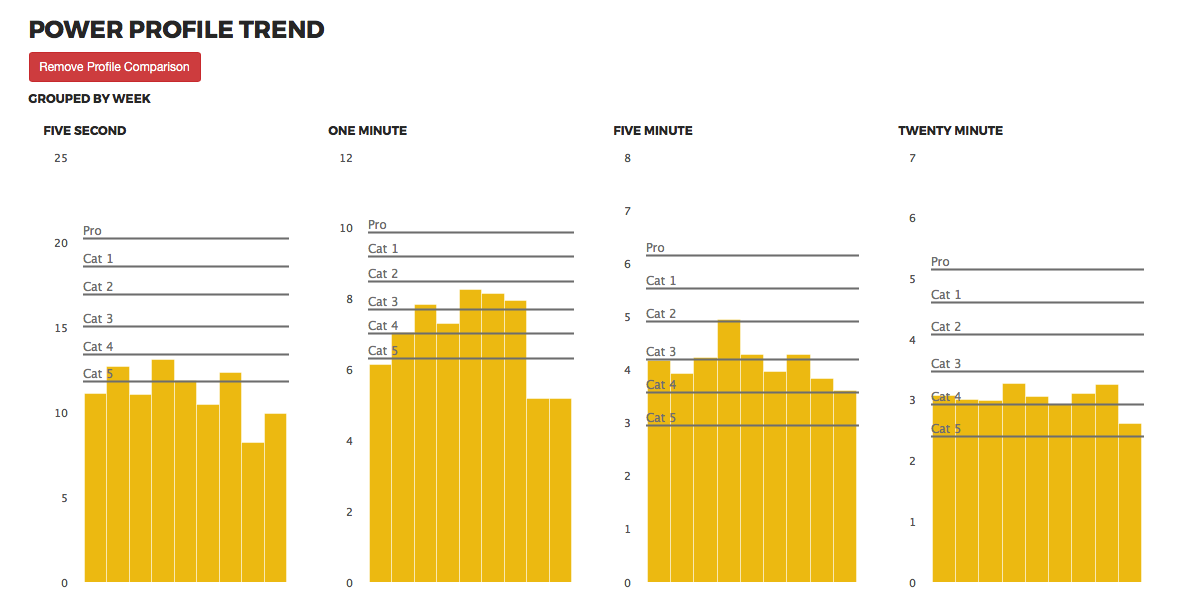
Profile Comparison overlay
While you've always had access to max power profile comparisons (cat 1, cat 2, etc), you can now overlay that same information on the power profile trend chart. This gives you the perspective of improvement over time, and how far you have until you reach the next comparison level.
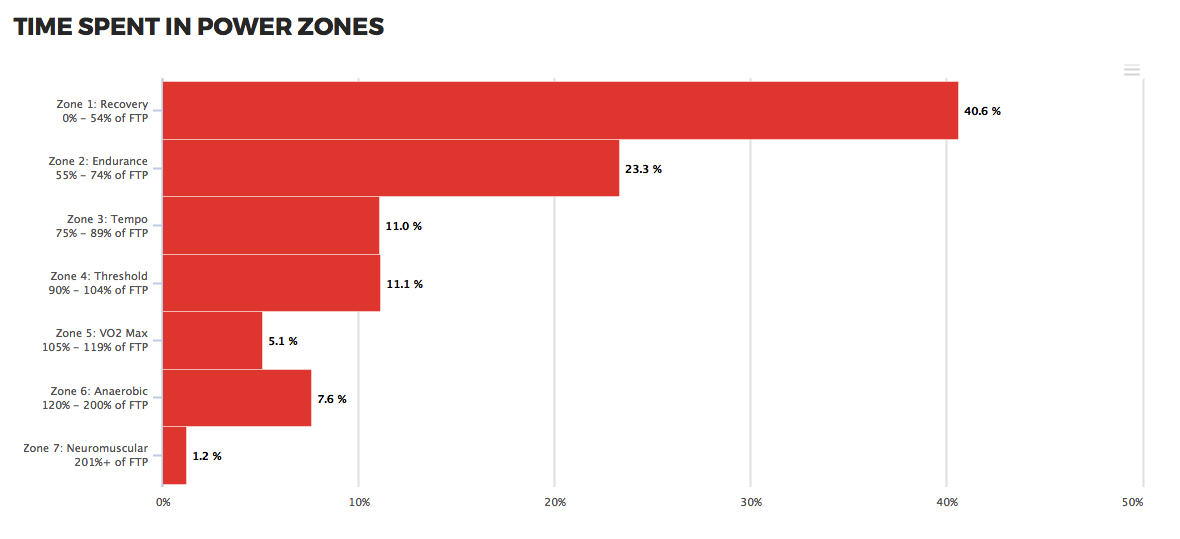
More descriptive power zone labels
This is short and simple: the Power Zones chart now features the percentages for each zone. When viewing this same chart for a specific ride, you'll have wattage zones based on the actual FTP from that ride.
Overlay stress scores on the performance chart
Another simple but useful update is the ability to overlay stress information on the performance chart. Stress is denoted by the gray bars, while future predicted rides are a slightly transparent gray.
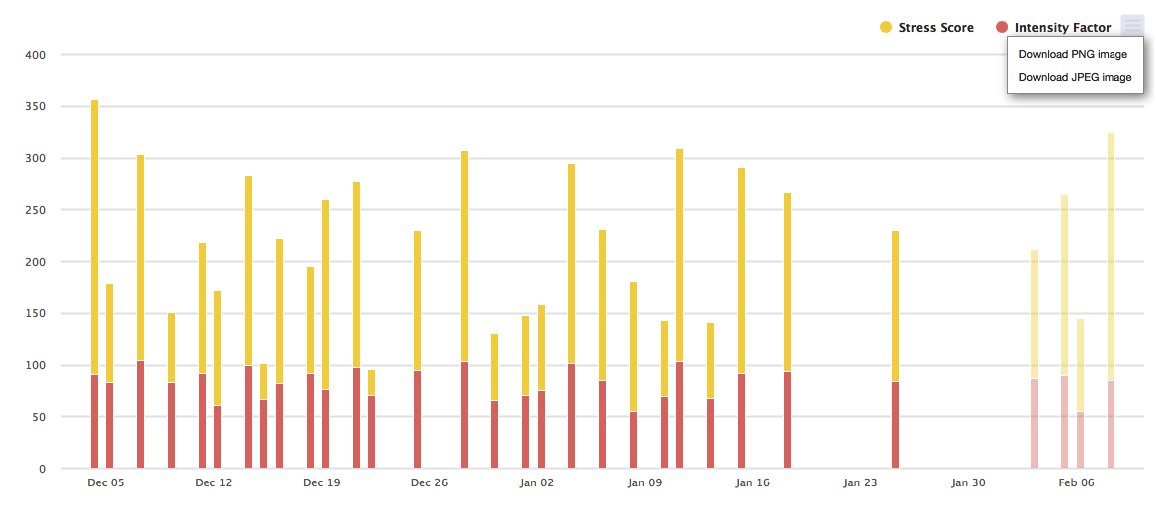
Export images
And last but not least is the ability to export charts to PNG or JPEG format.
Improved Performance Algorithm
You may have noticed that we updated the algorithm and your performance numbers changed. We've toned down the algorithm so that the peaks aren't quite as high and the valleys aren't quite as low. We know that might annoy you, but we promise we won't change the algorithm again. If you'd like, you can switch back to the old algorithm on your account settings page.
FTP Estimates
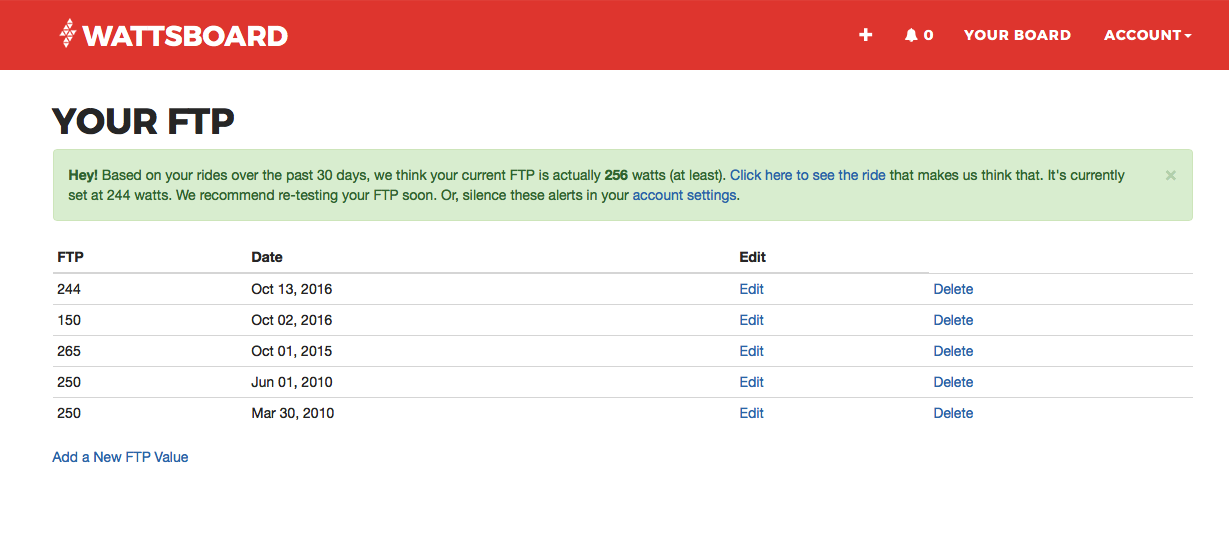
I've received quite a bit of feedback regarding FTP estimates. We've now implemented a solution that will alert you if your FTP is set too low. Here's how it works: we take a look at your 20 minute and 60 minute power data from the past 60 days. If we find that your FTP is set lower than what the data says it should be, we'll let you know. If it's set higher than what the data says it should be, we won't say anything. The reason we don't say anything is that you may not have been riding your hardest over the past 30 days. We'll leave the rest up to you.
That's it! We're continuing to increase stability along with additional features that should make power analysis even more simple and useful. Let us know if you have any suggestions!
Comments